Thursday, May 30, 2019

How to find out code of SAP icon

Codes of SAP icons are used in ABAP report in some cases. For example of here a dynpro having some icons assigned to particular data rows in table grid there can be a logic which evaluates what is value of particular icon. In case one needs to debug it and perhaps change the icon, (means change value of the icon’s code) it is handy to know these codes. Because the icon can only be entered into debugger by providing its value.

Recently I debugged some BW’s UD Connect data source screens and I came across statement that evaluated value of the icon:

Variable icon_bw_datasource declared in Type group called ICON. In this particular type group, there are more than 1200 icons available.

The type group are available from Data Dictionary related t-codes like SE11. 

How to find out when and who ran what APD

Sometime it is needed to find out when some APDs were running, who ran them and so on. In case the APD name is known, it is easy. One just needs to go to APD maintenance part of t-code RSA1. That screen can be also accessed directly via t-code RSANWB. Here just particular APD needs to be displayed and there is a Monitor icon available on its tool bar.

The monitor of the APD has also separate t-code called RSANWB_MONITOR. Report behind this t-code  is called RSAN_PRR_MONITOR_NO_SEL_SCREEN. The report just submits other report RSAN_PRR_MONITOR. Finally, the later report calls FM RSAN_PRR_MONITOR_START where all logic of the APD monitor is developed.

However, what to do in case that APD name that ran is not known. In such a case t-code SLG1 can be leveraged. By supplying string RSANPR into Object field of the SLG1.

SLG1 -> Object = RSANPR

Tuesday, May 21, 2019

How to find out APD that have Performance Settings set to Process Data in Memory

APD processes have an option of processing all data in memory. This means that data of the APD is stored entirety in main memory while processing. It can be set in maintenance screen of the APD there in menu called Goto there is an option Process Data in Memory. Normally this shall be set on for small amounts of data.

In case large volume of data (couple of millions) are being processed like that, execution of such APD may terminate once the main memory no longer has sufficient space for the data.

Now how to find out what APDs are having this flag set on? Data element corresponding to this flag is RSAN_PROCESS_IN_MEMORY_FLAG. However, it is not saved directly in some tables. Main table that stores data about the APDs is RSANT_PROCESS. That one contain column called XML. In this column all settings like filters, mapping etc is stored. Here within the XML column there is a section called PROCESS_DATA_IN_MEMORY. If it is equal to X then it means that the APD is processed in memory.


I created small ABAP program that list out all APDs, which have Performance Settings set to Process Data in Memory. The program is available at my github.


Sunday, May 19, 2019

Switching to BEx Query Designer from SAP BI front end tools

Running BEx Query Designer (QD) directly from BI front-end tool is very common case especially when the QD opened directly the query, which is displayed in the front end tool. Having this function in place means no need to open the QD separately and no need to find the particular query in the QD while it is opened.

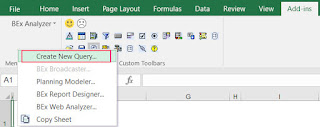
BEx Analyzer has this function for a very long time. It is available via menu Business Explorer -> Analyzer -> Choose Add-Ins, and from BEx Analysis Toolbox, choose Tools -> New Query.


In Analysis for Office (AfO) which is supposed to be replacement for BEx Analyzer this function was missing in its earlier versions. However at least in 2.6 the function is there. It needs to be enabled first by customizing the AfO’s UI. This is available via menu Analysis -> Custumize Analysis -> Custumize User Interface. 


On this pop-up window under Ribbon, part there is a Tools section available and under that one “Launch Query Designer” needs to be ticked off.


Finally, the BEx QD is available on AfO's ribbon: